
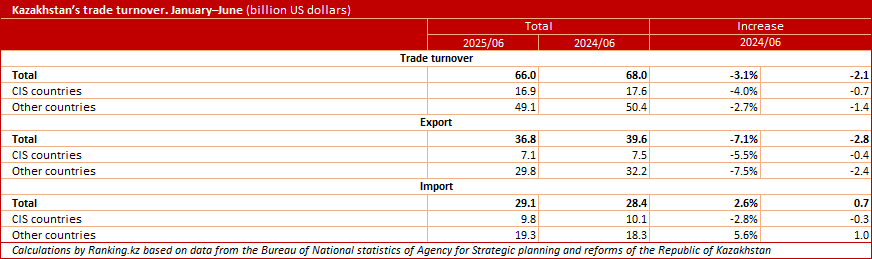
In January–June of this year, Kazakhstan’s total trade turnover amounted to 66 billion US dollars, down 3.1% year-on-year. Trade with CIS countries reached 16.9 billion US dollars (25.6% of the total), while trade with the rest of the world stood at 49.1 billion US dollars.
Kazakhstan’s exports totaled 36.8 billion US dollars, a decline of 7.1% compared with January–June 2024. Of this, 7.1 billion US dollars went to CIS countries and 29.8 billion US dollars to other countries. Meanwhile, imports into Kazakhstan rose by 2.6% to 29.1 billion US dollars, including 9.8 billion US dollars from CIS countries and 19.3 billion US dollars from other states.
Exports accounted for 55.8% of total trade turnover, while imports made up 44.2%. It was exports that drove the overall decline in trade.
The most active trade was with Europe, which accounted for 23.5 billion US dollars of Kazakhstan’s total turnover, followed by Asia with 22.6 billion US dollars and the Americas with 2.4 billion US dollars.
By country, Kazakhstan’s main trading partners were China (14.9 billion US dollars), Russia (12 billion US dollars), Italy (8.8 billion US dollars), the Netherlands (2.9 billion US dollars), Turkey (2.4 billion US dollars), France (2.3 billion US dollars), Uzbekistan (2.1 billion US dollars), Germany (2.1 billion US dollars), the United States (1.6 billion US dollars), and South Korea (1.5 billion US dollars).
The contraction in trade turnover was largely driven by a decline in average monthly Brent crude prices in the first half of the year (down 12%). Even the June rebound (up 7.7% compared to May) failed to offset the overall effect. This impact is evident in the structure of Kazakhstan’s exports.
Mineral products accounted for the largest share of external shipments in value terms, totaling 23.4 billion US dollars, or 63.5% of all exports. This category posted a sharp year-on-year decline of 10.3%.
Kazakhstan also exported metals and metal products (5 billion US dollars), agricultural and food products (3.2 billion US dollars), chemical and related industry products (2.6 billion US dollars), and machinery, equipment, transport vehicles, instruments, and devices (1.8 billion US dollars).
On the import side, the leading categories were machinery, equipment, transport vehicles, instruments, and devices (12.6 billion US dollars); chemical industry products (5 billion US dollars); agricultural and food products (3.5 billion US dollars); metals and metal products (2.8 billion US dollars); and mineral products (1.5 billion US dollars).
Export prices in June 2025 fell by 1.4% month-on-month but were up 3.6% year-on-year. Comparing January–June 2025 with the same period in 2024, export prices rose by 8.2%. At the same time, import prices increased by 0.7% over the month and 12% year-on-year, with a 10.5% rise in January–June 2025 compared with January–June 2024.